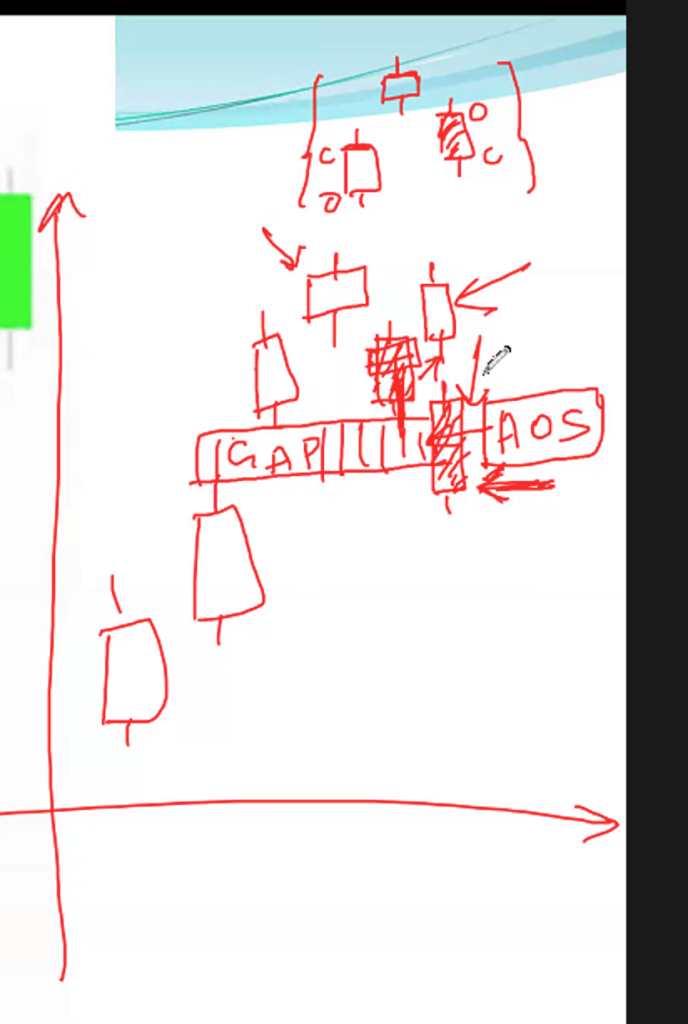
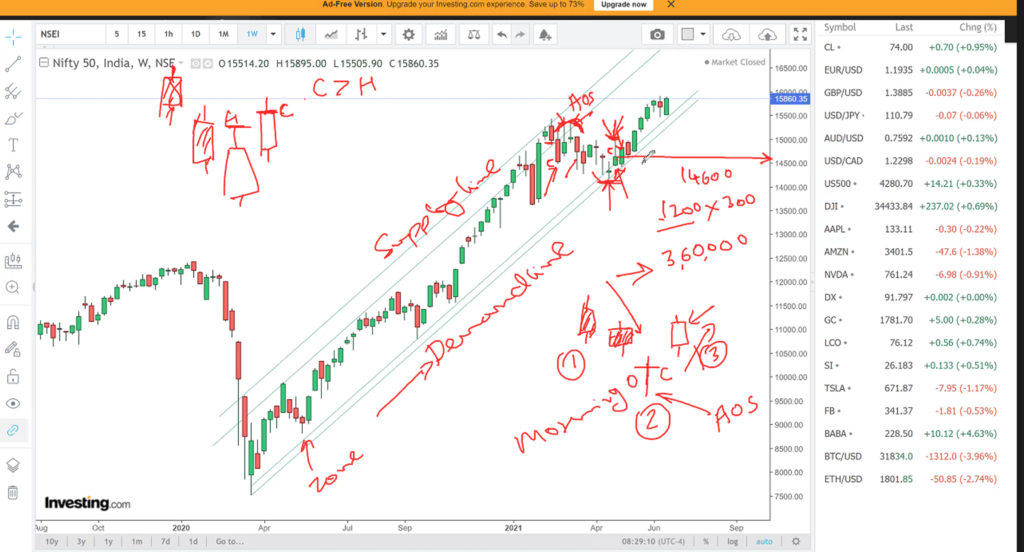
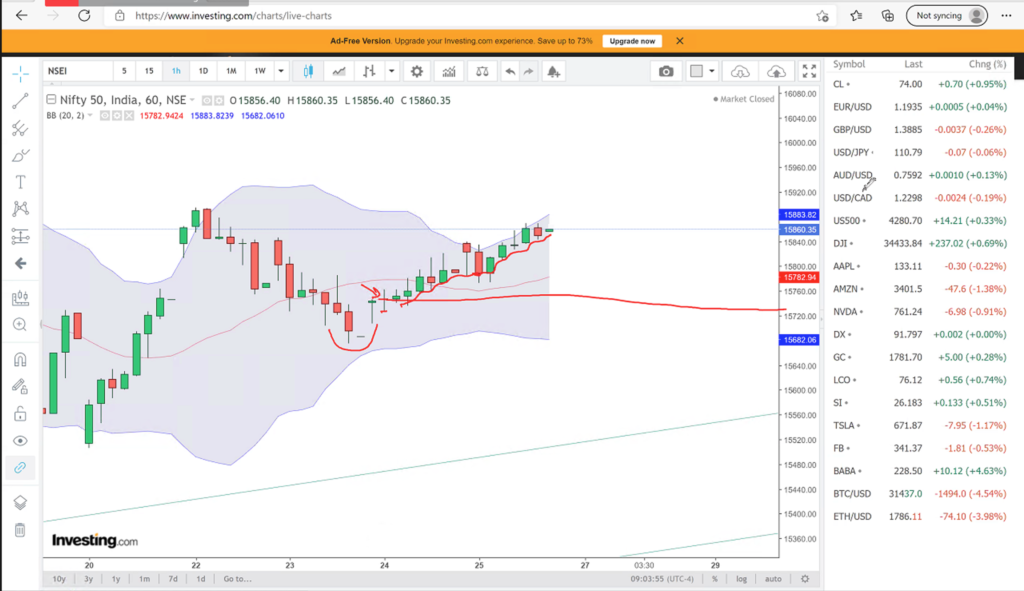
Check for GAP and Area of Significance
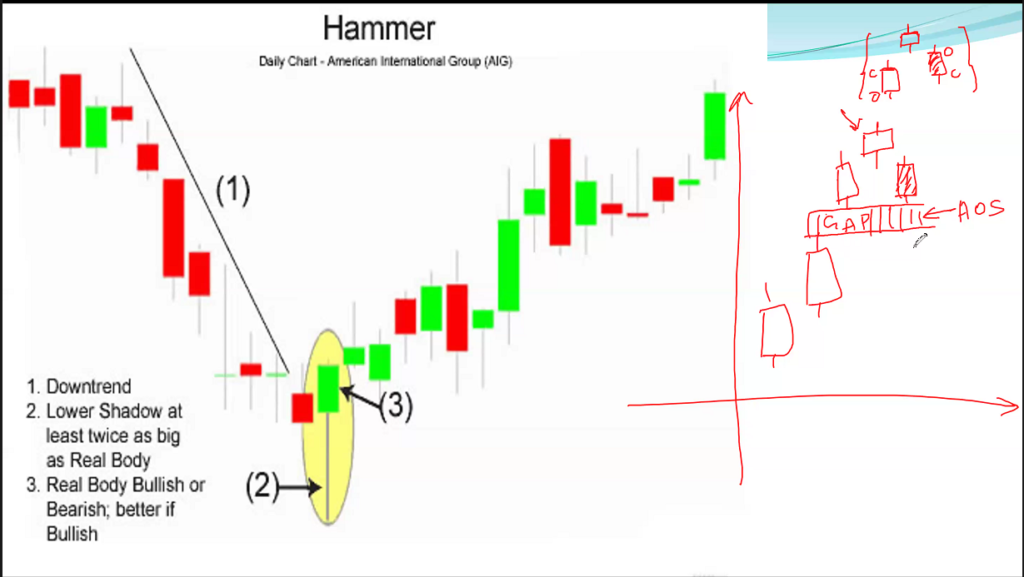
Demand / Supply
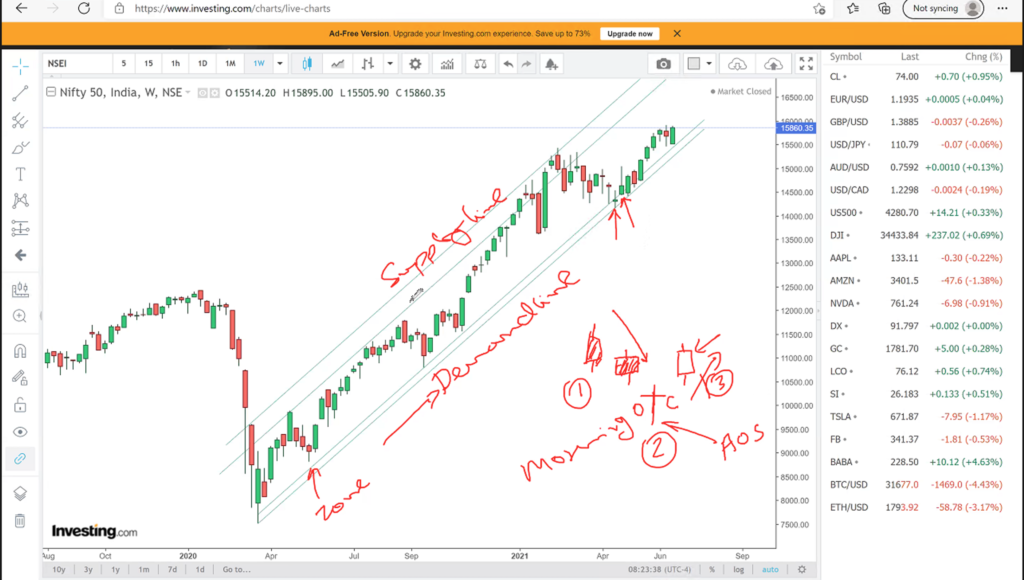
Close above previous high , AOS (near demand zone) Weekly chart
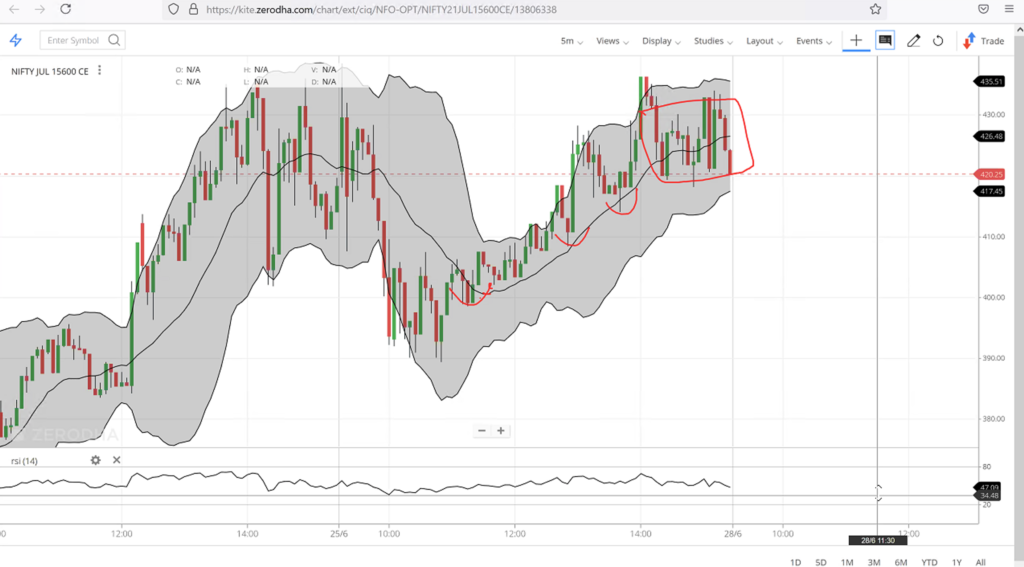
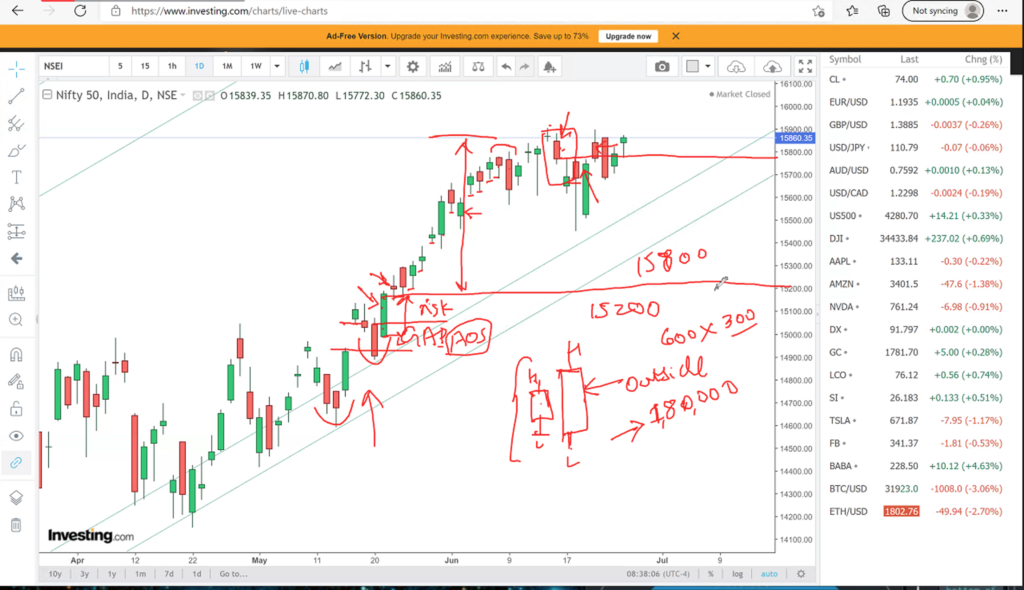
Now analyse the daily chart

Bearish candle was not confirmed, GAP Acts as support
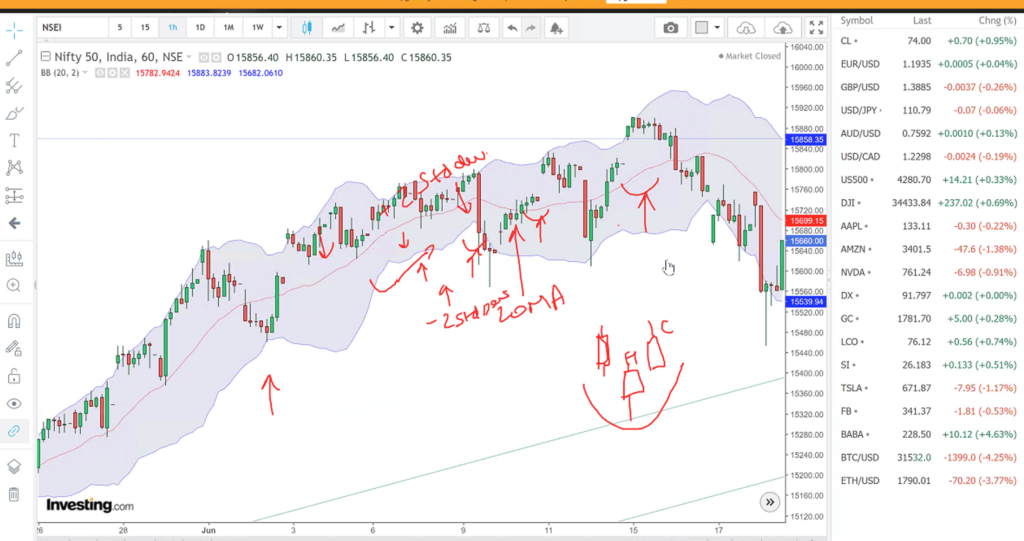
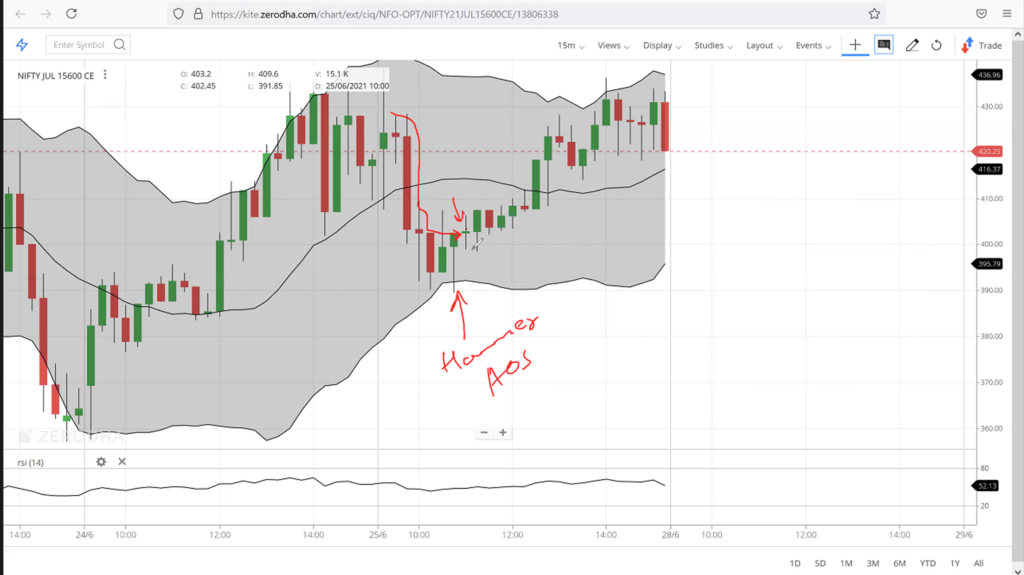
Bollinger Band to identify AOS ( are we seeing morning star at support, or evening star at supply
How to Enter
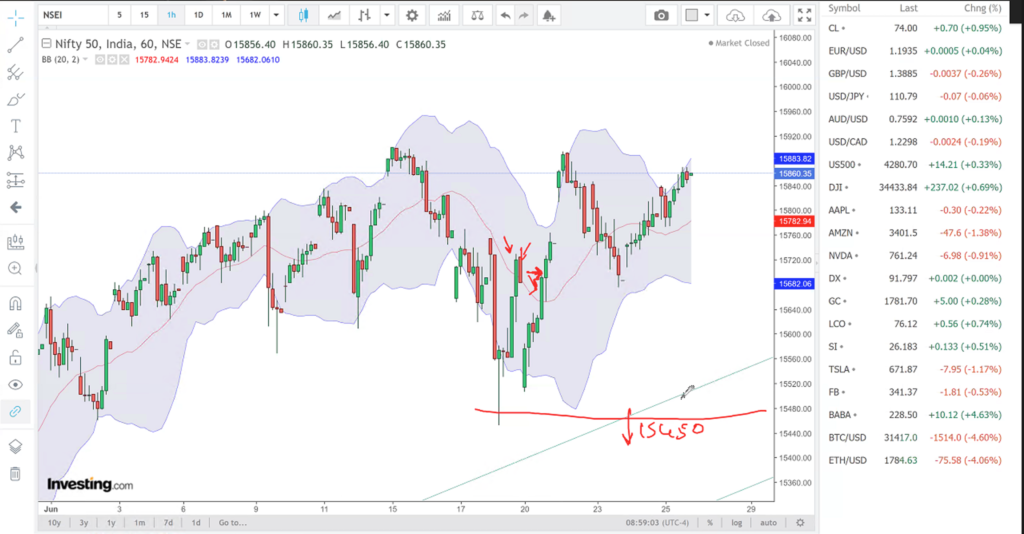
Not a single close below prior candle low
In 15minutes was there a close below previous candle low
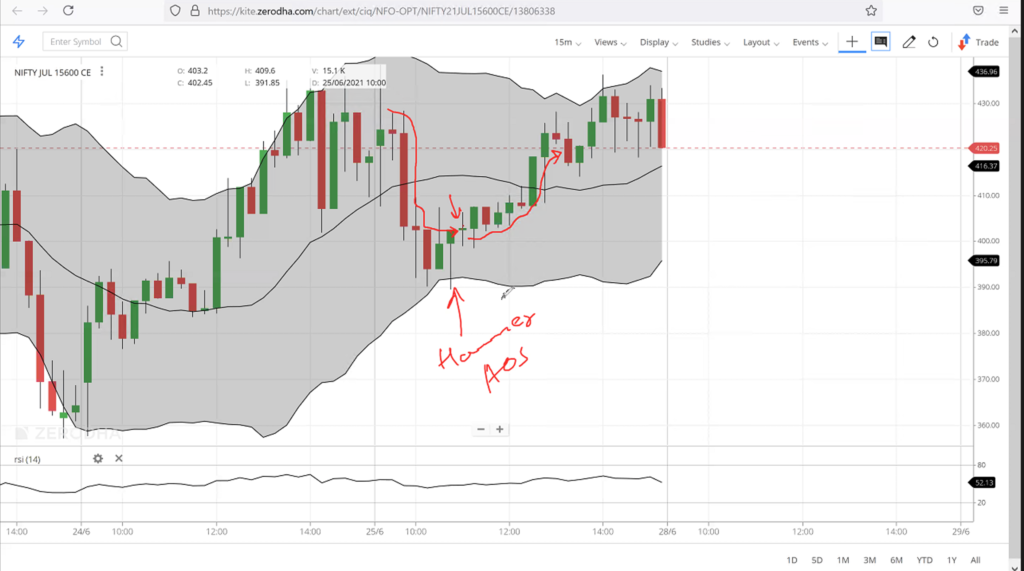
check later in moved sideways